

Methods
Exploring the frontiers of science often require new tools and innovations. In our group we are interested in developments of new methods. Here are two examples of the methods that we have been advancing in our lab.
Measurements of low melting temperature of metals and indirect resistance micro-calorimetry (IRMC) in a diamond anvil cell
By applying Mott’s empirical equation of electrical resistivity of liquid metals to the size of the jump, the latent heat of fusion can be estimated.
Previously there has been no method for determining the latent heat of fusion of metals at extreme pressures in the Mega bar range. Our method brings this unique capability to determine the latent heat of fusion in metals with melting temperatures that can be achieved in a resistively heated DAC. This method also provides a simple solution for determining the melting temperature of metals and the latent heat of fusion of all alkali metals under extreme pressures.
Simultaneous comparative transport measurements in a diamond anvil cell (DAC)
Due to different DAC designs or particular experimental designs or goals, uncertainties in the determination of the temperature of a given sample exist.
To overcome the inaccuracy in comparing the temperature dependence of transport properties of different materials at high pressure, we have used a new design of resistivity measurement in a twin sample chamber built on an insulated gasket in a DAC. In this design, the transport properties of two samples will be measured simultaneously. The uncertainties in the temperatures of the two samples will be exactly the same and therefore their relative phase diagram will be compared precisely.
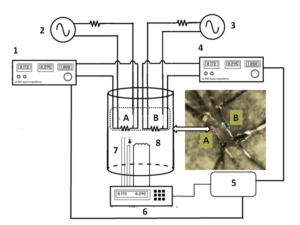
On left schematic drawing of electrical measurement circuit inside a cryostat. The lock-in A and B are running in two different frequency to eliminate interference. Inset shows the actual double quasi-four probes built on the gasket.
Measurement circuits for sample for A and B respectively:
SR830 Lock-in amplifiers,
SR830 Function generators (2 and 3).
Computer (5).
CryoCon temperature controller (6).
Diode thermometer (7).
Heater (8).
On right the correlation between the pressures in the two chambers up to 11 GPa. Three rubies across each sample chamber are distributed for evaluating the pressure gradient (blue boxes). The blue line has a slope of 1. Red is a linear fit to PA vs. PB.